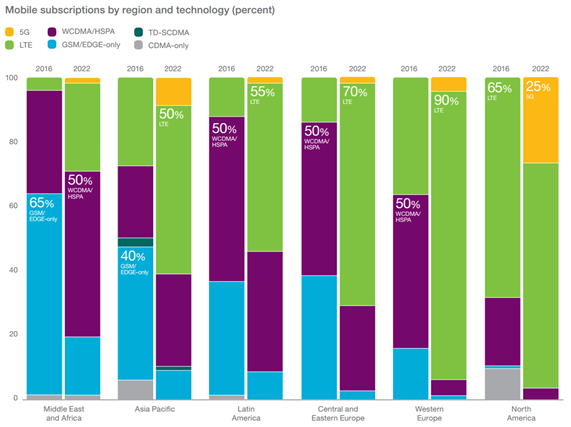
  Released on Tuesday, the latest edition of the Ericsson Mobility Report forecasts that there will be 550 million 5G subscriptions in 2022. North America will lead the way in uptake of 5G subscriptions, where a quarter of all mobile subscriptions are forecast to be for 5G in 2022.
Asia Pacific will be the second fastest growing region for 5G subscriptions, with 10 percent of all subscriptions being 5G in 2022. From 2016 to 2022, Middle East and Africa will dramatically shift from a region with a majority of GSM/EDGE-only subscriptions, to 80 percent of all subscriptions on WCDMA/HSPA and LTE.
By the end of 2016, there will be 3.9 billion smartphone subscriptions. Almost 90 percent of these subscriptions will be registered on WCDMA/HSPA and LTE networks. By 2022, the number of smartphone subscriptions is forecast to reach 6.8 billion, with more than 95 percent of the subscriptions registered on WCDMA/HSPA, LTE and 5G networks.

“Almost 90 percent of smartphone subscriptions are on 3G and 4G networks today and standardized 5G networks are expected to be available in 2020. We are already seeing a great interest among operators in launching pre-standard 5G networks. 5G will accelerate the digital transformation in many industries, enabling new use cases in areas such as IoT, automation, transport and big data,” said Ulf Ewaldsson, Chief Strategy and Technology Officer, Ericsson.
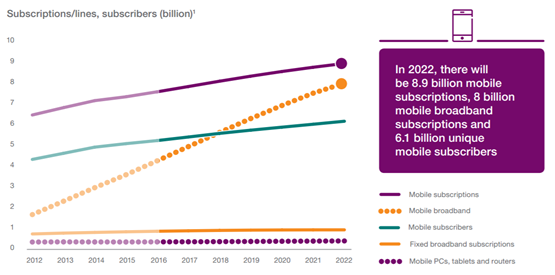
The latest Ericsson Mobility Report also forecasts that in 2022, there will be 8.9 billion mobile subscriptions, of which 90 percent will be for mobile broadband. At this point in time, there will be 6.1 billion unique subscribers.

As of Q3 2016, 84 million new mobile subscriptions were added during the quarter to reach a total of 7.5 billion, growing at around 3 percent year-on-year. India grew the most in terms of net additions during the quarter (+15 million), followed by China (+14 million), Indonesia (+6 million), Myanmar (+4 million) and the Philippines (+4 million). Mobile broadband subscriptions are growing by around 25 percent year-on-year, increasing by approximately 190 million in Q3 2016 alone. The total number of mobile broadband subscriptions is now around 4.1 billion.
Mobile data traffic continues to grow, driven both by increased smartphone subscriptions and a continued increase in average data volume per subscription, fueled primarily by more viewing of video content. In Q3 2016, data traffic grew around 10 percent quarter-on-quarter and 50 percent year-on-year.
Further highlights from the Ericsson Mobility Report include:
Mobile video traffic is increasingly dominant: Mobile video traffic is forecast to grow by around 50 percent annually through 2022 to account for nearly 75 percent of all mobile data traffic. Social networking is the second biggest data traffic type after video, forecast to grow by 39 percent annually over the coming six years.
Live streaming joins social media: Consumers are increasingly using live video streaming apps to interact with friends, family and followers. Around one in five smartphone users in the US express an interest in live video broadcasting, with twice as many smartphone users in high growth markets like India, Indonesia, Brazil and Oman who are interested in such apps.
IoT in focus: Around 29 billion connected devices are forecast by 2022, of which around 18 billion will be related to IoT. Included in the latest edition of the Ericsson Mobility Report is a deeper look into IoT, with three feature articles with different perspectives on IoT and its transformational potential. Two articles are co-written with operators that have built IoT solutions around their core assets, creating additional business value. The third article explores the cellular networks’ capabilities to support a realistic massive IoT use case scenario.
The Ericsson Mobility Report is an industry-leading publication on mobile data traffic, providing in-depth measurements from live networks spread around the globe. The report uses these measurements and analysis, together with internal forecasts and other relevant studies, to provide insights into current traffic and market trends in the Networked Society.
The Traffic Exploration Tool, which accompanies the report, can be used to create customized graphs and tables. The information can be filtered by region, subscription, technology, traffic and device type. |